
The South African Adventure Begins.

The adventure starts with a fervent love for sports and an innocent belief that performance can be ‘quantified’ and comprehended. In 1998, I set out for South Africa, leaving behind the familiar comforts of the UK, equipped with a Sports Science degree, a laptop, and a life packed into two bags.
Initial Steps.
My arrival at the Sports Science Institute of South Africa (SISSA) was promising; however, it soon became evident that the science of team sports was primarily confined to a handful of practitioners focusing on elite rugby players.
My research initially explored the effectiveness of a repeated sprint test to assess athletes' fitness levels. Unfortunately, at that time, there was no method to correlate these scores with the movement patterns observed in live performances. This marked my first foray into notational analysis and time-motion studies. I successfully convinced the UCT Exercise, Sports Science, and Sports Medicine department (ESSM) to lend me their video camera from the biomechanics department, while also persuading my father to loan his camera. With these tools, I managed to devise a protocol to record field hockey matches, ensuring that all outfield players were captured by at least one camera throughout the game.
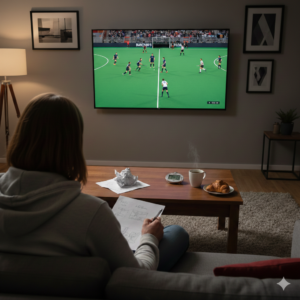
The data collection process was quite rudimentary, relying on a television to replay the footage, a stopwatch, a pencil, and a scaled drawing of a hockey field. Every 15 seconds, I plotted the position of a single player on the pitch, marking it with a time code. Assuming the player participated for the entire 70 minutes, I ended up with 280 time-stamped points indicating the distance covered during the match. I then calculated 'speeds' by measuring the distance between each plotted point, scaling it up to the full size of the hockey field, and dividing by 15 seconds.


Translating the data into usable insights
I completed this project with over 60 sheets of paper, documenting 2,800 time-stamped locations for one squad (with a maximum of 14 outfield players) across three different matches. Thankfully, this laborious process has since been made easier with GPS technology.
Take Home Thoughts
By grasping some fundamental principles of physics and employing creativity with available resources, it is indeed possible to document and analyze performance without specialized equipment—provided you have the time!